Majority of Americans (60%) and Wedding Professionals (64%) believe businesses should be required to serve same-sex couples
In 2014, the Pew Research Center found that an almost equal split of Americans believed that businesses should be required to serve same-sex couples (49%) as should be allowed to refuse services for religious reasons (47%). And, though the Supreme Court may have settled the question of marriage equality in 2015, it, like the wedding industry itself, did not resolve the simmering debate about whether or not wedding professionals should be compelled to serve same-sex couples if they opposed same-sex marriage. With Masterpiece Cakeshop v. the Colorado Civil Rights Commission on the Fall 2017 U.S. Supreme Court docket, this study sought an updated take on this question from the general population, while also asking wedding professionals to weigh in on the question: should businesses be allowed to refuse to serve same-sex couples?
Key findings include:
- A majority of Americans (60%) believe that wedding professionals should be required to serve same-sex couples; only 26% support service refusal.
- A slightly higher majority of wedding professionals (64%) compared to the general population believe that wedding professionals should serve same-sex couples.
- LGBTQ-identified individuals (73%) are more likely than their heterosexual peers (57%) to oppose same-sex wedding-related service refusal.
- Led by New England (69%), the majority on both coasts oppose service refusal; central regions more closely split.
- Millennials (66%) are more likely than other generational groups to oppose service refusal.
- Majority of Caucasian, Hispanic, Black and Asian/Pacific-Islander-identified respondents oppose service refusal
- Those who do support service refusal are most likely to cite business autonomy (43%) or religious beliefs (33%) as reasons why.
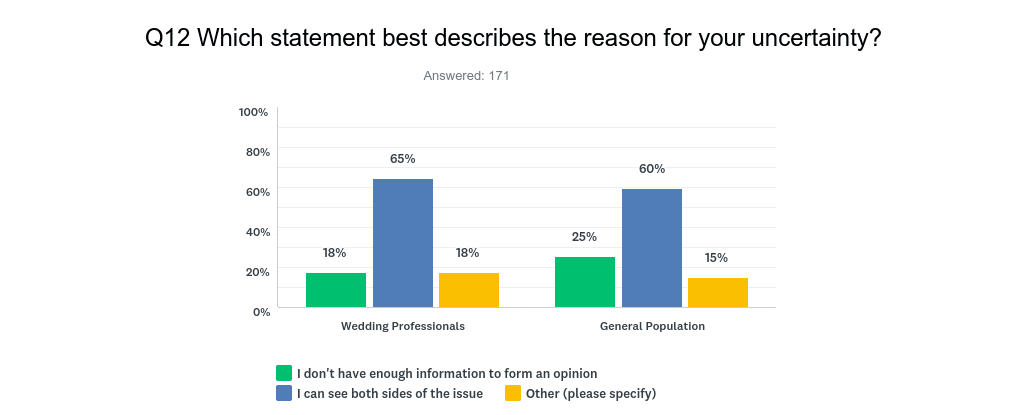
- A majority of those “unsure” about the question of service refusal (60%) cite seeing “both sides of the issue” as reasons for their ambivalence.
- Many of the respondents who elaborated on their ambivalence of and support for service refusal added that they don’t support discrimination against same-sex couples.
Methodology
This MBKinsights / SurveyMonkey Audience survey was conducted online from Aug 28 – Sept 10, 2017 among a national sample of (N= 1,226) adults ages 18 and older, and social media recruitment of wedding industry professionals (N= 197). Respondents for this survey were selected from the nearly 3 million people who take surveys on the SurveyMonkey platform each day, and were weighted using data from the US Census Bureau to reflect the demographic composition of the United States.
Results
A majority of Americans (60%) support requirement that wedding professionals serve all couples; only 26% support service refusal
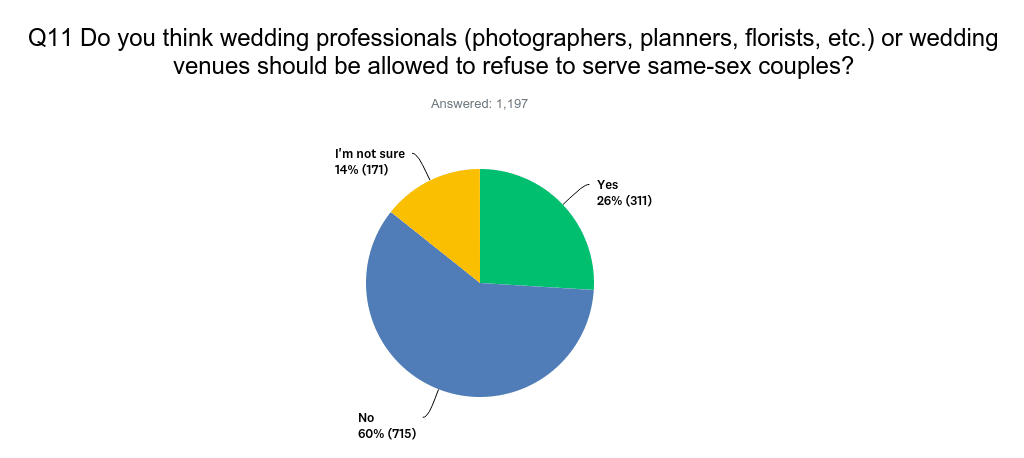
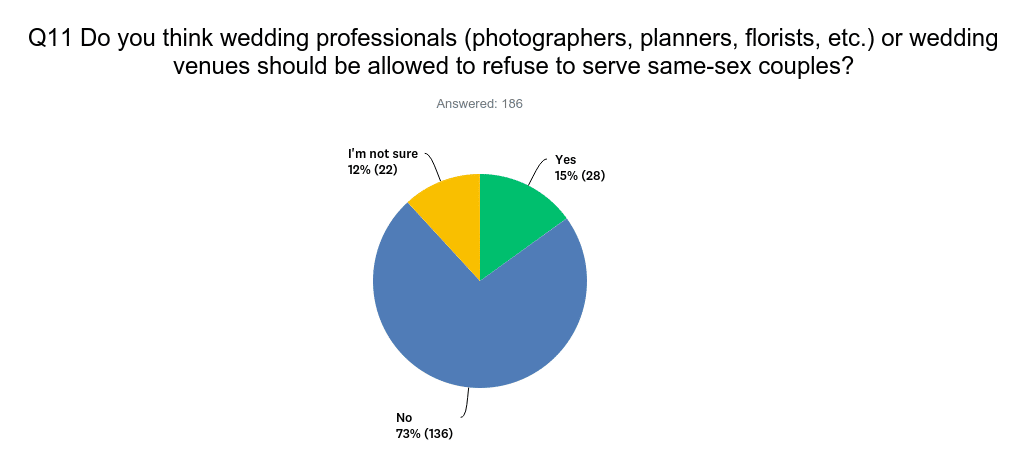
Only 26% of the general population reports an unequivocal support of service refusal (see Fig. 1). Of this group (who support service refusal), 43% indicated that they believe businesses should be able to serve whomever they want to serve, and 33% indicated that they believe wedding professionals should be able to refuse service based on their religious beliefs. The majority of the general population surveyed — 60% — opposes service refusal.
Wedding professionals are more inclined than the general population to believe that wedding professionals should serve same-sex couples.
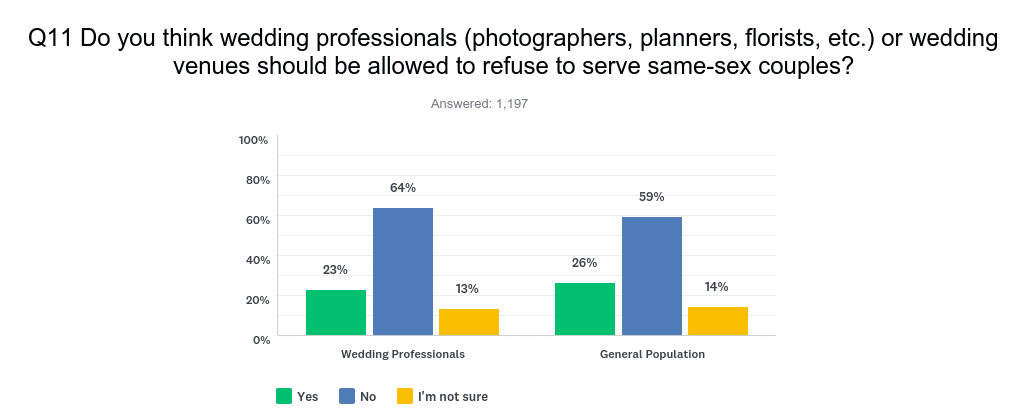
Wedding professionals (64%) are slightly more inclined than the general population (59%) to say that wedding professionals should not be able to refuse service based on sexual orientation (see Fig. 2). Only 23% of wedding pros and 26% of the general population support service refusal. The majority of respondents (wedding pros and the general population combined) who answered that they were “not sure” about their opinion (see Fig. 3), said that their uncertainty links to being able to “see both sides of the issue” (Wedding Pros, 65%; General Population, 60%).
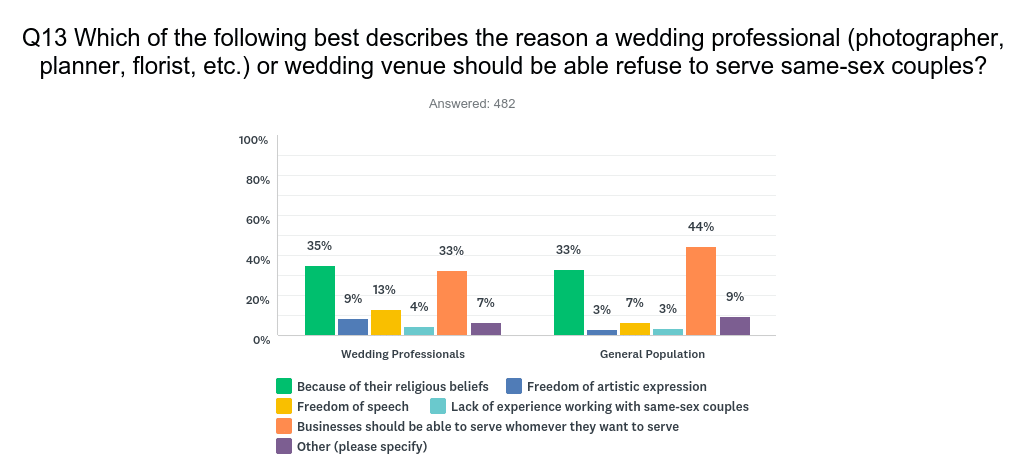
When it comes to reasons why the respondents felt that service refusal by wedding professionals is acceptable (see Fig. 4), a higher number of the general population (44%) said that “businesses should be able to serve whom they want” compared to wedding pros (33%). Interestingly, though not statistically significant, slightly more wedding pros (35%) supported religion as a reason for service refusal than business autonomy. And, generally speaking, wedding professionals were more likely to support “freedom of artistic expression” and “freedom of speech” as reasons to support service refusal (22%) than the general population (10%).
LGBTQ-identified individuals are more likely than heterosexual peers to oppose service refusal
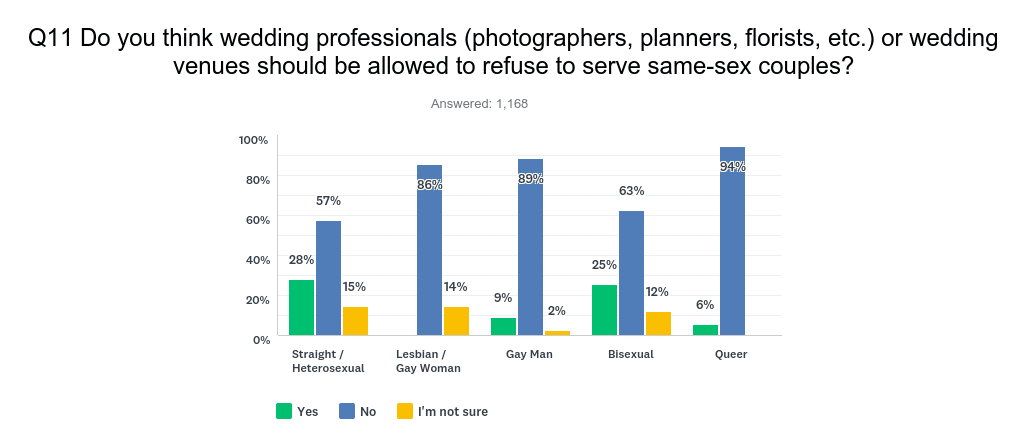
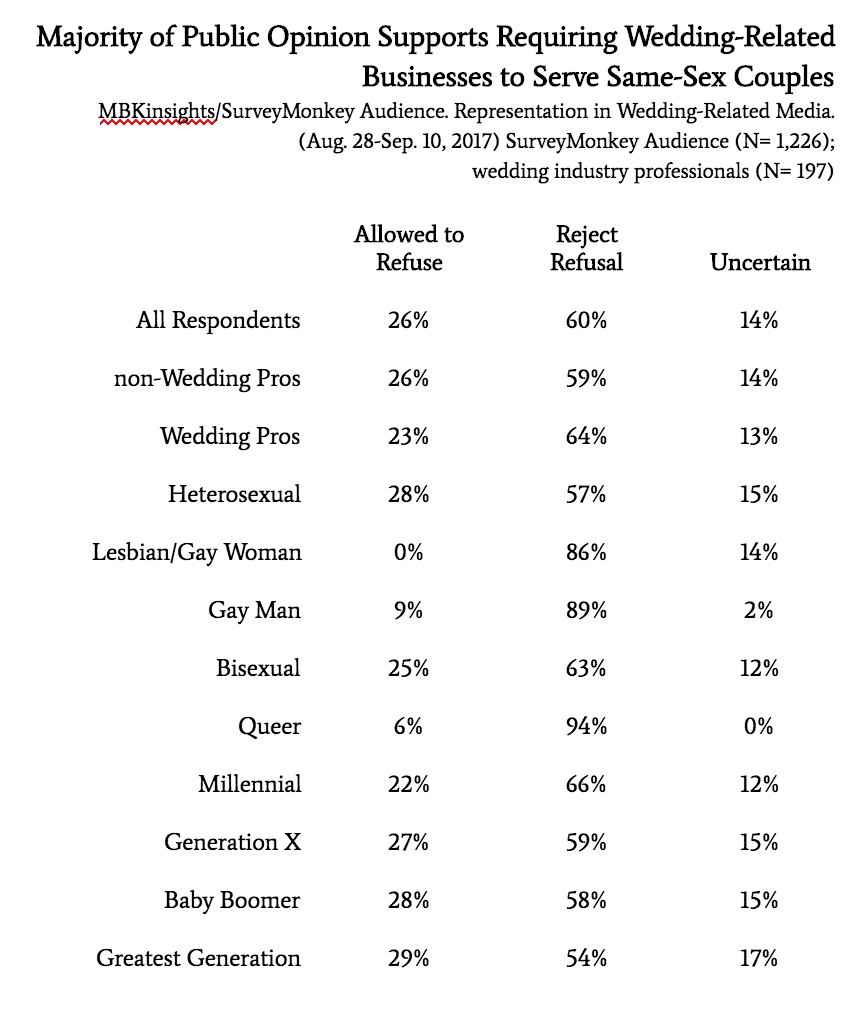
Not surprisingly, there are clear differences in how LGBTQ-identified respondents feel about the question of service refusal relative to heterosexual-identified respondents. Seventy-three (73%) of LGBTQ-identified respondents objected to service refusal, compared to 57% of heterosexual-identified respondents (see Fig. 5).
Queer-identified respondents (94%) were most likely to respond “No” when asked if wedding professionals should be allowed to refuse to serve same-sex couples, followed by Gay Men (89%), Lesbian/Gay Women (86%) and Bisexual respondents (63%) (see Fig. 6). One in four Heterosexual- (28%) and Bisexual-identified (25%) respondents opted “Yes” on the question of service refusal, with a small minority of Queer- (6%) and Gay Male-identified (9%) respondents saying “Yes.” Zero (0%) Lesbian-identified respondents support service refusal.
Led by New England (69%), the majority on both coasts oppose service refusal; central regions more closely split.
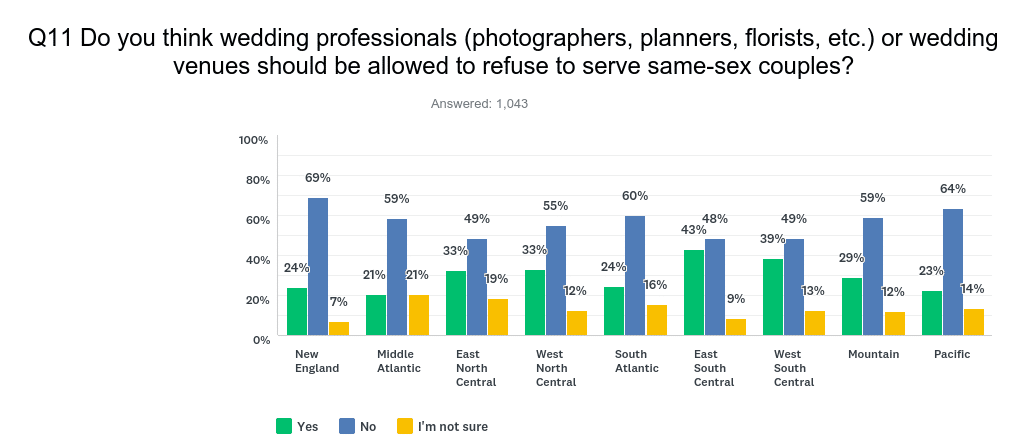
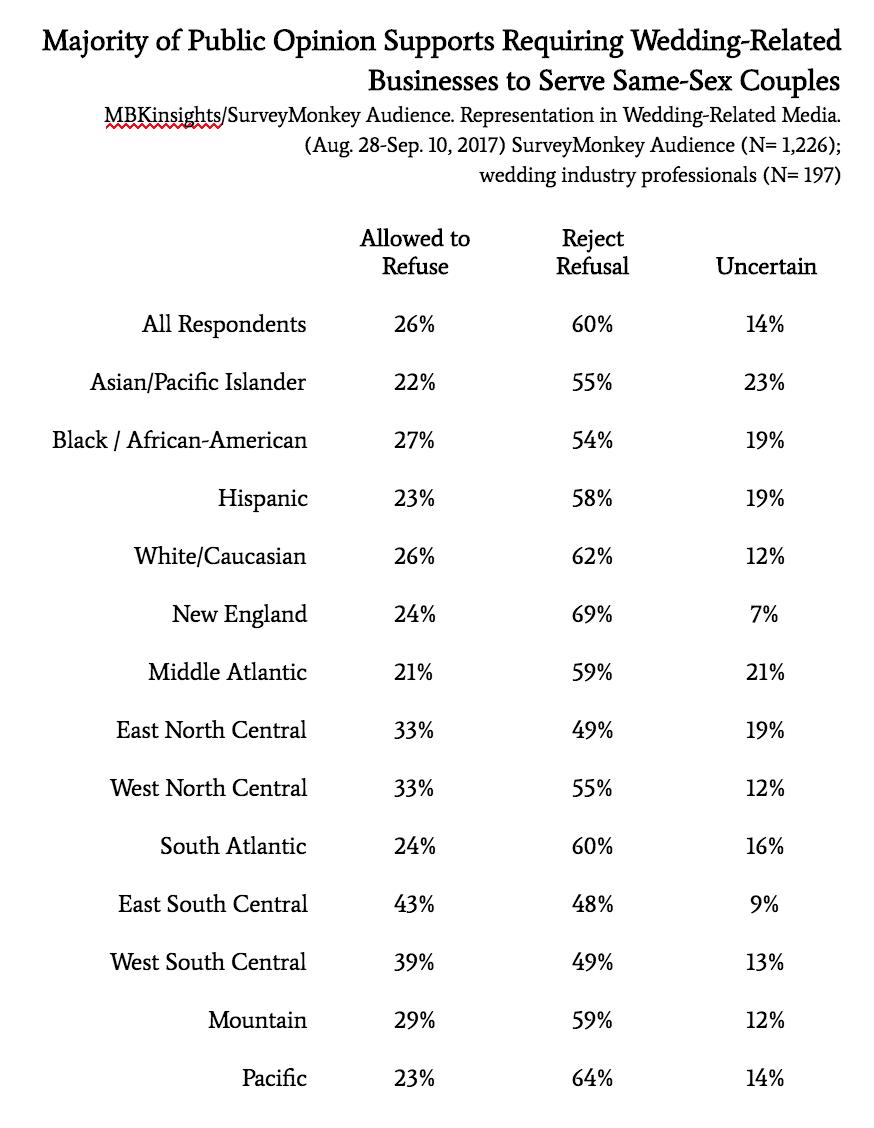
A majority of respondents from the East Coast (New England – 69%, Mid-Atlantic – 59%, and South Atlantic-60%) do not believe that wedding professionals should be allowed to refuse to serve same-sex couples, as do those from West Coast regions (Pacific- 64%, and Mountain – 59%) (see Fig. 7). With the exception of the West North Central region (55%), which includes North Dakota, South Dakota, Nebraska, Kansas, Minnesota, Iowa, and Missouri, respondents from the central regions (East North Central – 49%, East South Central – 48%, West South Central – 49%) were largely split on the question of service refusal. Respondents from the East South Central region, which includes, Kentucky, Tennessee, Mississippi and Alabama, were most closely split with 43% in support of service refusal and 48% against it.
Millennials are more likely than those from other generations to oppose service refusal
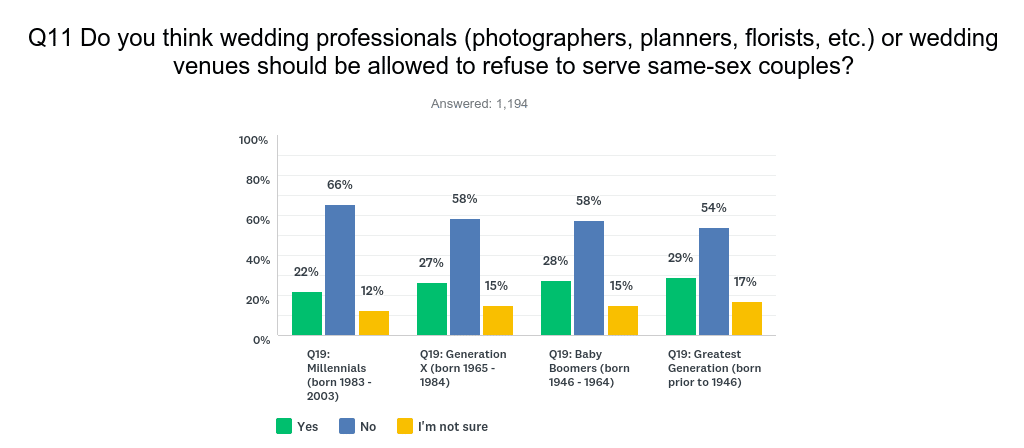
Age of respondent reveals a significant difference in response to this question (see Fig. 8). Sixty-six percent (66%) of Millennials (higher than the national average of 60%) do not believe that wedding professionals or venues should be allowed to refuse service to same-sex couples compared to 58% of Baby Boomers and 54% of Greatest Generation, both (below than the national average).
Majority of Caucasian, Hispanic, Black and Asian/Pacific-Islander-identified respondents oppose service refusal
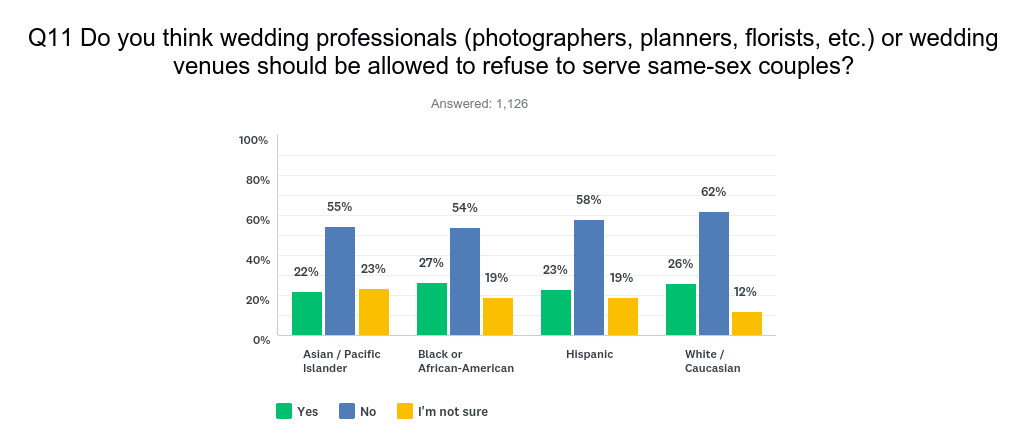
Caucasian respondents (62%) were most likely to say that wedding wedding professionals should be required to serve same-sex couples, but a majority of Hispanic (58%), Black/African-American (54%) and Asian-Pacific Islanders (55%) also oppose service refusal (see Fig. 9).
Many of those who elaborated on their support for service refusal also stated that they do not support discrimination against same-sex couples.
When asked “Which of the following best describes the reason a wedding professional or venue should be allowed to refuse to serve same-sex couples?” (see Fig. 4), 9% of the general population selected “Other (please specify).” Most re-stated their support of the right of businesses to refuse service if they so choose, but added that they personally do not support discrimination against same-sex couples. Many also stated the belief that couples have the opportunity and responsibility to choose to work with a different, accepting business from the wider marketplace.
Examples include:
- “I agree that businesses should be allowed to chose to serve whomever and should not be punished for doing so. I’d be happy to serve any couple regardless or sexual orientation, but I still believe that other people have the right to their own beliefs.”
- “I don’t agree with people refusing anyone based on race, religious beliefs and so on. However, I also don’t believe someone should be forced to work with a couple if their beliefs differ. It’s such a slippery slope though, so this isn’t an easy answer.”
- “Discrimination is awful and a wedding couple should be able to get married wherever they want to get married with whomever they want to work with but if the vendor doesn’t want to work with them then they shouldn’t want to give their money to that person.”
Many of those who were uncertain about the question of service refusal described their support of self-determination for businesses, but opposition to discrimination against same-sex couples.
When asked “Which statement best describes the reason for your uncertainty (about allowing businesses to refuse to serve same-sex couples)?” (see Fig. 3), 15% of general population (and 18% of Wedding Professionals) selected “Other (please specify).” Interestingly, their answers were similar to those who answered “Other (please specify)” to the question: “Which of the following best describes the reason a wedding professional or wedding venue should be able to refuse service?”. Most of these respondents reported that they did not think business owners should discriminate, and that they don’t agree with those who do, but they also explained that businesses should have autonomy and that customers (in this case, engaged couples) can and should take their business elsewhere.
Examples include:
- “On the one hand, it should be the right of businesses to choose their clientele. On the other hand, we wouldn’t accept a business not serving racial minorities, and refusing to serve people based on their sexual orientation is no less discriminatory. So my uncertainty is mainly about the degree to which government should become involved in the enforcement of morality.”
- “I absolutely don’t think discrimination should be allowed but if someone doesn’t want to work with an LGBTQ couple or for any reason then I don’t want to work with them & certainly don’t want to put money in their pockets. So yes or no isn’t really an option on this question.”
- “If it’s a private business, it’s up to the owner. But I think they should be stigmatized for doing so.”
Conclusions
The question of wedding-related service refusal was not settled by the wedding industry or the courts with the advent of marriage equality in 2015. If anything, debate became more heated through media reports of vocal opponents on both sides of the question. Meanwhile, the wedding industry and the majority of the general population have quietly come to expect that same-sex couples can and should be served when it comes to wedding planning.
In fact, this study found that a majority of Americans (60%) and an even stronger majority of wedding professionals (64%) and Millennials (66%) believe that businesses should be required to serve same-sex couples. A shrinking minority of Americans (26%), wedding professionals (23%), and Millennials (22%) disagree. Perhaps most surprising is the number of those surveyed who indicated that they support service refusal or are unsure if they support it, but responded that, though they believe a business should decide its policy for itself, they also believe businesses shouldn’t discriminate against same-sex couples. Thus, it is likely that same-sex couples can expect to find even more support from the public and within the wedding industry than a binary answer to the question of service refusal might reveal at first glance.
For more information about this report, submit your inquiry.
Download the Brief Report – [PDF] or the Full Report – [PDF].
About MBKinsights
MBKinsights seeks to better understand and explain overlooked trends and attitudes. Analyst and educator Kathryn Hamm is best known for her work in the wedding industry, where she writes, speaks and consults with wedding professionals about LGTBQ wedding trends, multicultural inclusion, best practices when serving today’s couples, and how to think ‘outside the box’ when considering the modern market. She is co-author of The New Art of Capturing Love: The Essential Guide to Lesbian and Gay Weddings; Publisher of GayWeddings; and an Education Expert for WeddingWire, the nation’s leading technology company serving the $200+ billion wedding, corporate, and social events industry.


Pingback: #AM_Equality Tipsheet: December 6, 2017 – Moments for Equality